 Prior Trading Day Summary:
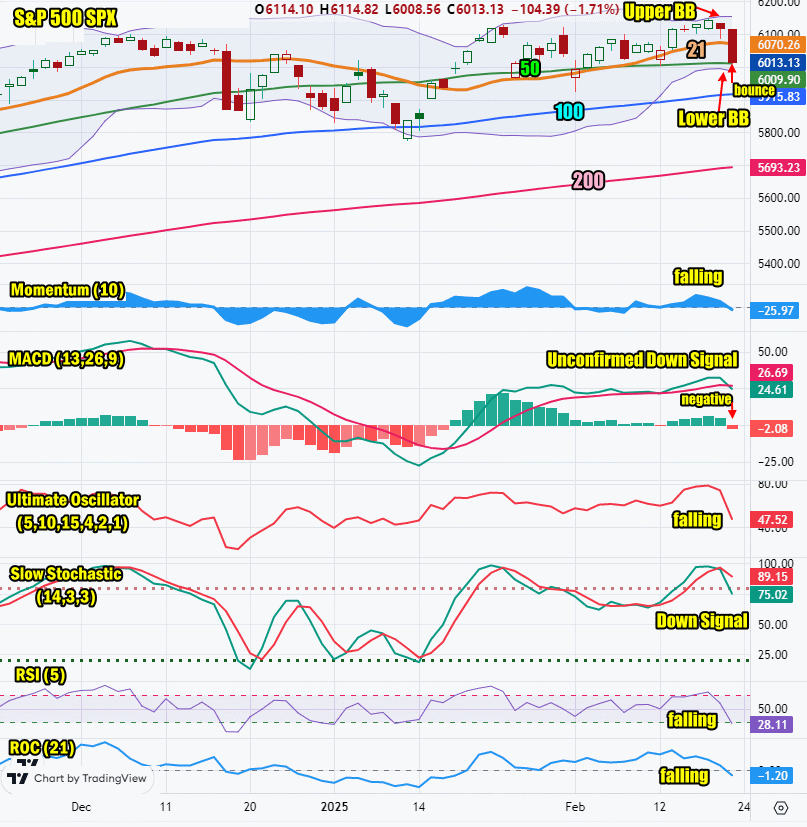
On Friday stocks continued their decline which had started on Thursday. Volume jumped as the indexes fell lower and by the close the index was near the low of the day. The SPX saw 5.5 billion shares traded with 77% of that volume trading lower. 72% of stocks were falling by the close. The loss was 104 points to end the day at 6013 for the largest decline since December 18 when the index lost a huge 178 points.
The NASDAQ lost 438 points on 8.7 billion shares traded. 64% of al volume was to the downside and 73% of stocks were falling. The NASDAQ ended the week down 502 points to 19,524.
Selling was brisk on both exchanges on Friday and stocks were oversold by the close. Let’s see what the likelihood is of a bounce Mon Feb 24 2025 to start the final week of February.
Stock Market Outlook: SPX Closing Chart For Fri Feb 21 2025
The index fell below the 21 day moving average and closed at the 50 day. This is bearish.
The closing candlestick is very oversold and a bounce is likely on Monday.
The 21 day moving average is falling and closed at 6070 which is bearish.
The 50 day moving average is falling and closed at 6009 which is bearish.
The 100 day moving average is rising and closed at 5915 which is bullish.
The 200 day moving average is rising and closed at 5693 which is bullish.
The Lower Bollinger Band is falling which is bearish at present. The Upper Bollinger Band is turning sideways which is bearish. The present Bollinger Bands Squeeze is showing signs that stocks may move lower out of the squeeze this week.
For Monday the SPX chart is split almost equally between bearish and bullish readings.

SPX Stock Market Outlook review of Fri Feb 21 2025
Stock Market Outlook: Technical Indicators Review
Momentum: Momentum is falling and negative.
|
MACD Histogram: MACD (Moving Averages Convergence / Divergence) issued an up signal on Fri Jan 17 2025. A new unconfirmed down signal was issued at the close on Fri Feb 21.
|
Ultimate Oscillator: The Ultimate Oscillator is falling sharply.
|
Slow Stochastic: The Slow Stochastic has a down signal in place for a second day and is not overbought.
|
Relative Strength Index: The RSI signal is falling sharply and nearing oversold readings.
|
Rate of Change: The rate of change signal is falling, signaling Monday will end lower.
|
Stock Market Outlook: Support and Resistance Levels |
| 6150 is resistance |
| 6125 is resistance |
| 6100 is resistance |
| 6090 is resistance |
| 6070 is resistance |
| 6050 is resistance |
| 6025 is resistance |
| 6015 is resistance |
| 6000 is support |
| 5990 is support |
| 5970 is support |
| 5950 is support |
| 5900 is support |
| 5890 is support |
| 5875 is support |
| 5850 is support |
Stock Market Outlook for Mon Feb 24 2025
For Monday Feb 25, the index is sitting just above strong support which is at 6000. A bounce off this level is likely, even if any bounce ends up with the index moving back lower.
Technical indicators are bearish with a couple of the signals strongly bearish. Meanwhile the MACD indicator issued an unconfirmed down signal on Friday at the close. That might get confirmed today although the outlook is for the SPX to open higher, dip slightly and then try to push still higher. I am expecting a positive close but the SPX could be just at 6050 by the close. No events are scheduled on the economic front. That means stocks have a better chance of staging a bounce. The close should be higher today but we could see selling return tomorrow. We will know more once Monday ends and we see the technical indicator readings.
Potential Economic and Political Market Moving Events
Monday:
No events
