 Prior Trading Day Summary:
On Tuesday stocks were choppy as Fed Chair Powell testified in front of Congress. In the end though the testimony offered nothing new and perhaps more important, no new worries.
The close saw the SPX up just 2 points to 6068. The NASDAQ fell slightly, down 70 points to 19643.
Let’s review the technical indicators at the close on Tue Feb 11 2025 to see what to expect for Wed Feb 12 2025.
Stock Market Outlook: SPX Closing Chart For Tue Feb 11 2025
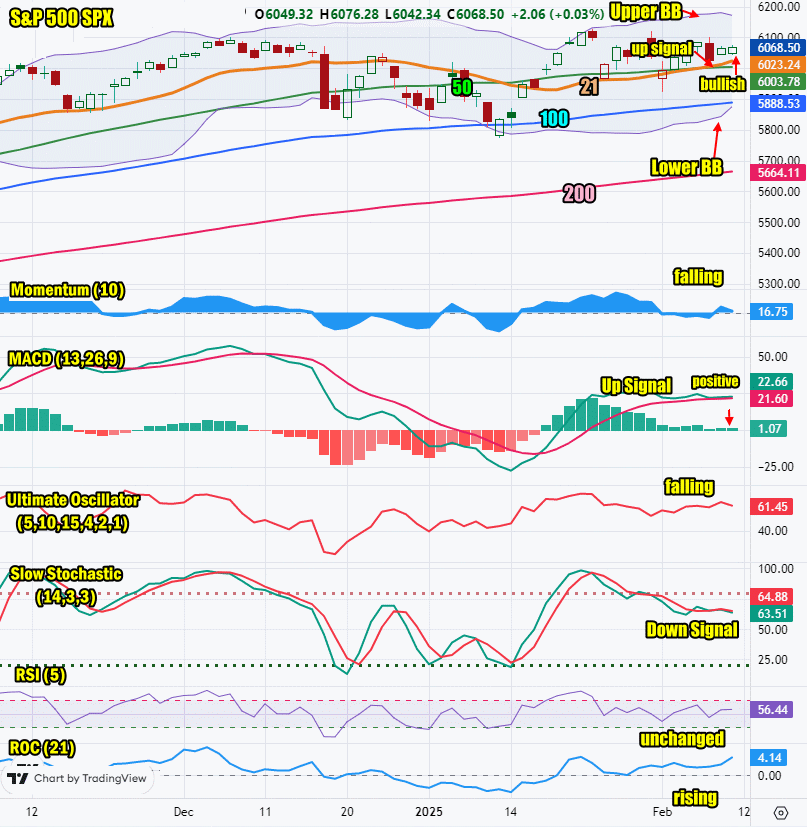
The index closed above all major moving averages but still lower than Thursday last week. This is bearish.
The closing candlestick is bullish for Wednesday but has a short shadow which signals that dips may be slight on Wednesday.
The 21 day moving average is continuing to move above the 50 day moving average which is a major up signal.
The 21 day moving average is rising and closed at 6023 which is bullish.
The 50 day moving average is rising and closed at 6003 which is bullish.
The 100 day moving average is rising and closed at 5888 which is bullish.
The 200 day moving average is rising and closed at 5664 which is bullish.
The Lower Bollinger Band is rising which is bullish. The Upper Bollinger Band is falling which is bearish.
For Wednesday the SPX chart is more bullish than bearish but the candlestick and Upper Bollinger Band are signals of some weakness expected today.

SPX Stock Market Outlook review of Tue Feb 11 2025
Stock Market Outlook: Technical Indicators Review
Momentum: Momentum is falling and positive.
|
MACD Histogram: MACD (Moving Averages Convergence / Divergence) issued an up signal on Fri Jan 17 2025. The up signal is flat but still positive.
|
Ultimate Oscillator: The Ultimate Oscillator is falling.
|
Slow Stochastic: The Slow Stochastic has a down signal in place.
|
Relative Strength Index: The RSI signal is unchanged.
|
Rate of Change: The rate of change signal is rising and signaling Wednesday will end higher.
|
Stock Market Outlook: Support and Resistance Levels |
| 6125 is resistance |
| 6100 is strong resistance |
| 6090 is resistance |
| 6070 is resistance |
| 6050 is resistance |
| 6025 is resistance |
| 6015 is resistance |
| 6000 is resistance |
| 5990 is resistance |
| 5970 is support |
| 5950 is support |
| 5900 is support |
| 5890 is support |
| 5875 is support |
| 5850 is support |
| 5830 is support |
| 5800 is support |
Stock Market Outlook for Wed Feb 12 2025
For Wednesday the technical indicators are falling and signaling a growing chance of a down day shortly. Fed Chair Powell continues his testimony today and that could have stocks trending sideways through much of his testimony. Nothing new is expected however and the day looks strong enough for another higher close.
On Wednesday I am expecting a choppy day with dips but a higher close.
Potential Economic and Political Market Moving Events
Monday:
No events
Tuesday:
10:00 Fed Chair Powell testifies to Congress
Wednesday:
8:30 Consumer prince index is estimated to fall to 0.3%
8:30 CPI year-over-year is expected to slip slightly to 2.8% from 2.9%
8:30 Core CPI is estimated unchanged at 0.3%
8:30 Core CPI year-over-year is estimated to slip to 3.1% from 3.2% prior.
10:00 Fed Chair Powell continues testimony to Congress
2:00 Monthly federal budget is estimated to climb to -$11.0 billion from -$22 billion prior
