 Prior Trading Day Summary:
On Friday stocks fell after the January non-farm payroll report showed a decline in employment to 143,000 versus 169,000 expected. The unemployment rate however fell to 4.0%.
The SPX ended the day down 57 points and for the week it lost just 14 points to close at 6025.
The NASDAQ fell 268 points and for the week 104 points were lost. The index closed at 19523.
Let’s review the technical indicators at the close on Fri Feb 7 2025to see what to expect for Mon Feb 10 2025.
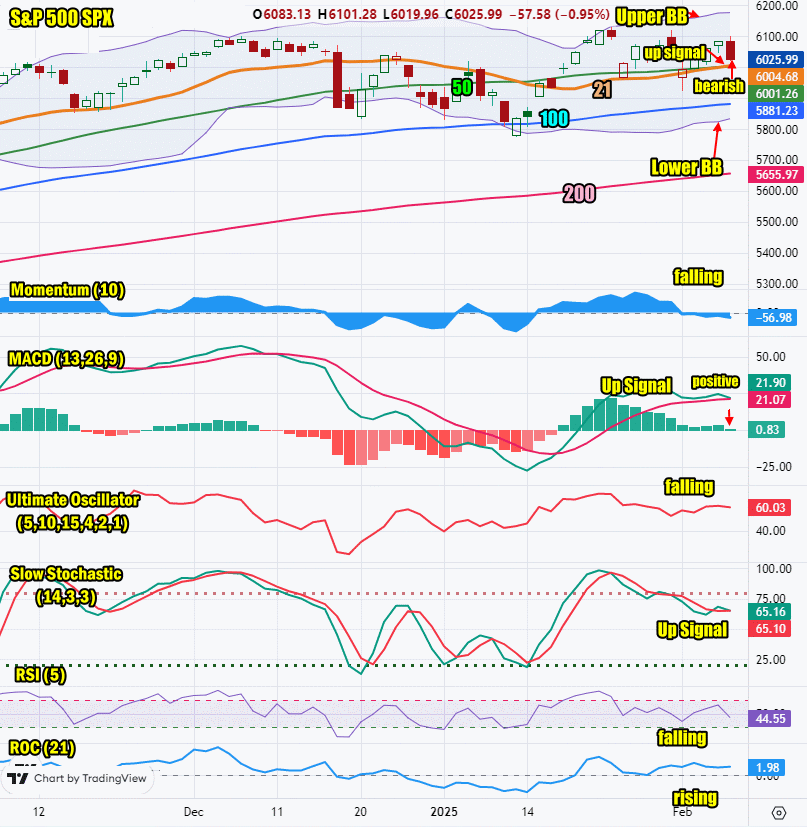
Stock Market Outlook: SPX Closing Chart For Fri Feb 7 2025
The index closed above the 50 and 21 day moving averages but lower than Thursday’s close. This is bearish.
The closing candlestick is bearish for Monday but has a short shadow which signals that dips may be slight on Monday.
The 21 day moving average is rising and closed at 6004, above the 50 day which is bullish.
The 50 day moving average is rising and closed at 6001 which is bullish.
The 100 day moving average is rising and closed at 5881 which is bullish.
The 200 day moving average is rising and closed at 5655 which is bullish.
The Lower Bollinger Band is rising which is bullish. The Upper Bollinger Band is rising which is bullish.
For Monday the SPX chart is more bullish than bearish. The day should close higher.

SPX Stock Market Outlook review of Fri Feb 7 2025
Stock Market Outlook: Technical Indicators Review
Momentum: Momentum is falling and negative.
|
MACD Histogram: MACD (Moving Averages Convergence / Divergence) issued an up signal on Fri Jan 17 2025. The up signal was almost gone on Fri Feb 7. I am expecting an unconfirmed down signal by the close today.
|
Ultimate Oscillator: The Ultimate Oscillator is falling.
|
Slow Stochastic: The Slow Stochastic is neutral with almost a down signal in place.
|
Relative Strength Index: The RSI signal is falling.
|
Rate of Change: The rate of change signal is rising and signaling Monday will end higher.
|
Stock Market Outlook: Support and Resistance Levels |
| 6125 is resistance |
| 6100 is strong resistance |
| 6090 is resistance |
| 6070 is resistance |
| 6050 is resistance |
| 6025 is resistance |
| 6015 is resistance |
| 6000 is resistance |
| 5990 is resistance |
| 5970 is support |
| 5950 is support |
| 5900 is support |
| 5890 is support |
| 5875 is support |
| 5850 is support |
| 5830 is support |
| 5800 is support |
Stock Market Outlook for Mon Feb 10 2025
For Monday, dips are likely however Friday’s closing candlestick advises that dips should not be deep and should find ready buyers.
With no economic or political events expected on Monday, the outlook is for a choppy day but with a higher close.
Potential Economic and Political Market Moving Events
Monday:
No events
