 Prior Trading Day Summary:
On Thursday stocks rose to close modestly higher ahead of Friday’s non-farm payroll report.
The SPX ended up 22 points at 6083 on 4.9 billion shares traded. only 48% of stocks were rising by the close.
The NASDAQ rose 99 points to end the day at 19,792 on volume of 6.9 billion shares traded. Only 45% of stocks were rising on Thursday.
With the January non-farm payroll numbers due to be released at 8:30 on Friday, let’s review the technical indicators at the close on Thu Feb 6 2025to see what to expect for Fri Feb 7 2025.
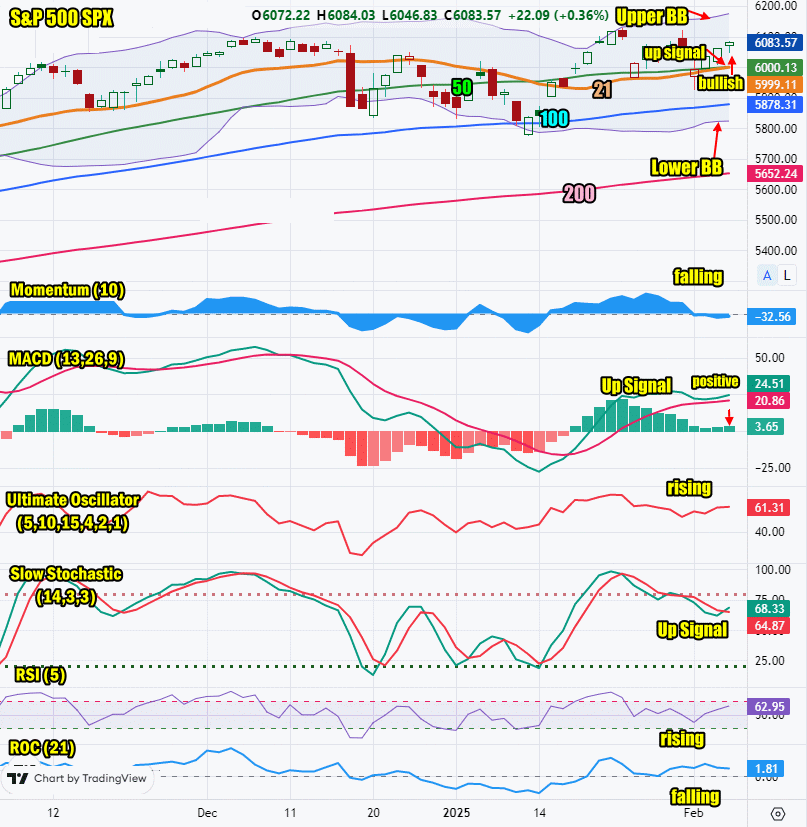
Stock Market Outlook: SPX Closing Chart For Thu Feb 6 2025
The index closed above the 50 and 21 day moving averages. This is bullish.
The closing candlestick has a long shadow which indicates dips will occur on Friday but a higher close is expected.
The 21 day moving average is rising and closed at 5999 and is now above the 50 day which issues a new up signal.
The 50 day moving average is rising and closed at 6000 which is bullish.
The 100 day moving average is rising and closed at 5878 which is bullish.
The 200 day moving average is rising and closed at 5652 which is bullish.
The Lower Bollinger Band is moving sideways which is neutral. The Upper Bollinger Band is rising which is bullish.
For Friday the SPX chart is more bullish than bearish. The day should close higher.

SPX Stock Market Outlook review of Thu Feb 6 2025
Stock Market Outlook: Technical Indicators Review
Momentum: Momentum is falling and negative.
|
MACD Histogram: MACD (Moving Averages Convergence / Divergence) issued an up signal on Fri Jan 17 2025. The up signal gained in strength on Thursday.
|
Ultimate Oscillator: The Ultimate Oscillator is rising.
|
Slow Stochastic: The Slow Stochastic has an up signal in place.
|
Relative Strength Index: The RSI signal is rising.
|
Rate of Change: The rate of change signal is falling and signaling Friday will end lower.
|
Stock Market Outlook: Support and Resistance Levels |
| 6125 is resistance |
| 6100 is strong resistance |
| 6090 is resistance |
| 6070 is resistance |
| 6050 is resistance |
| 6025 is resistance |
| 6015 is resistance |
| 6000 is resistance |
| 5990 is resistance |
| 5970 is support |
| 5950 is support |
| 5900 is support |
| 5890 is support |
| 5875 is support |
| 5850 is support |
| 5830 is support |
| 5800 is support |
Stock Market Outlook for Fri Feb 7 2025
The day will be about the January non-farm payroll report which is due out at 8:30 on Friday. Expectation is for 169,000 jobs to have been created which is well down from last month’s 256,000. A lower number could send stocks lower. At the same time too high a number may also send stocks lower. An employment number close to estimates should see the index move higher.
Once the morning ends the technical indicators will have more sway on market direction. The outlook is for a higher close, but dips are likely today.
Potential Economic and Political Market Moving Events
Monday:
9:45 S&P final manufacturing PMI for 2024 came in higher than estimated at 31.2
10:00 Construction spendin was higher than estimated at 0.5%
10:00 ISM manufacturing was higher than estimated at 50.9%
Intraday: Autosales were lower than estimated at 16.8 million vehicles
Tuesday:
10:00 Job openings fell more than expected to 7.6 million from 8.2 million
10:00 Factory orders fell more than estimated to -0.9%
Wednesday:
8:15 ADP employment jumped ahead of estimated and rose to 183,000
8:30 Trade deficit jumped to $98.4 billion for December
9:45 S&P final services PMI for January rose to 52.9 as expected
10:00 ISM services fell more than estimated to 52.8% for January.
Thursday:
8:30 Weekly Initial Unemployment Insurance Claims are estimated to rise to 214,000 from 207,000 last week.
8:30 Productivity is estimated to dip to 1.4% from 2.2% prior
Friday:
8:30 January jobs report is expected at 169,000 down from 256,000 prior
8:30 Unemployment rate is estimated to remain uncared at 4.1%
:00 Wholesale inventories are estimated to dip -0.5%
10:00 Consumer sentiment is estimated at 71.3, up from 711 recent.
3:00 Consumer credit is estimated at $14 billion, up from -7.5 billion.
