 Prior Trading Day Summary:
On Friday investors got better than expected bank earnings but sold bank stocks lower. The selling extended into other sectors until by the close the indexes were both down on the day and the week.
The S&P ended the day at 5114 down 84 on the day and 90 for the week. It also left the index at the 50 day moving average which should result in a bounce attempt to start the third week of April.
The NASDAQ closed at 16,151 falling 290 points on the day and 90 for the week.
The third week of April sees earnings getting into full swing. Stocks should either move higher if earnings surprise in strength or move lower if earnings disappoint. We will have a good idea by mid-week.
Let’s review the closing technical indicators on Fri Apr 12 2024 to see what to expect for Mon Apr 15 2024.
Stock Market Outlook: SPX Closing Chart For Fri Apr 12 2024
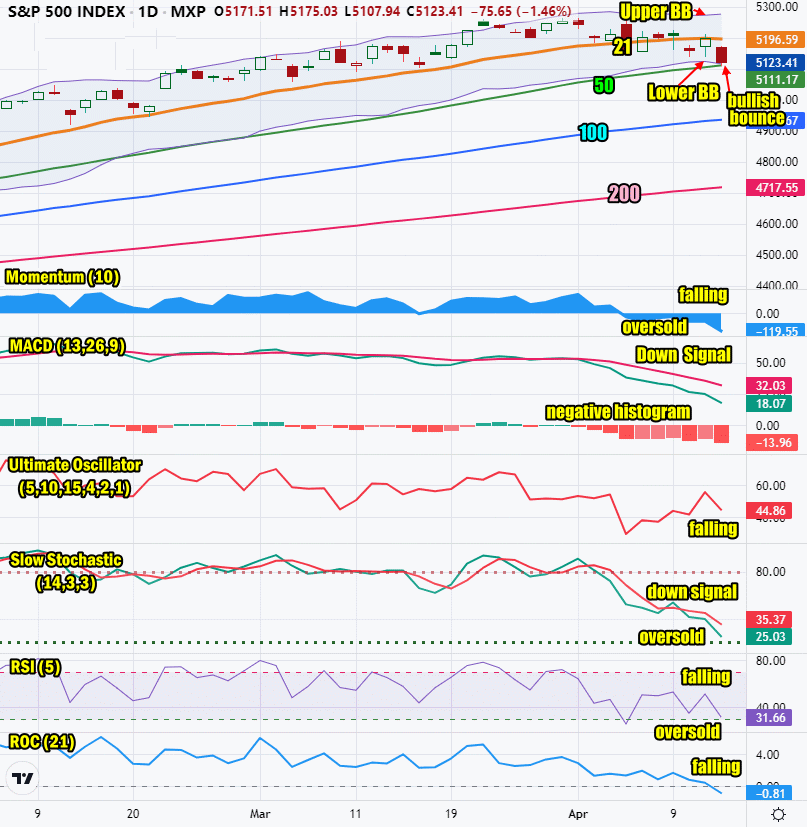
The index closed down at the 50 day moving average and the Lower Bollinger Band. This usually results in a bounce attempt.
The closing candlestick is signaling oversold and due to bounce.
The 21 day moving average is moving lower which is bearish.
The 50 day moving average is rising and at 5111, which is bullish.
The 100 and 200 day moving averages are climbing which is bullish. The 200 day is at 4717 on the SPX which is bullish.
The Bollinger Bands are in another Bollinger Bands Squeeze. The Lower Bollinger Band is turning lower with the Upper Bollinger Band also moving lower. A new Bollinger Bands Squeeze is underway and at present the squeeze looks like it will end with stocks moving lower.
The S&P chart is signaling a good chance for a bounce but more downside is possible after a bounce.
Stock Market Outlook: Technical Indicators Review
Momentum: Momentum is falling and negative. It is oversold.
|
MACD Histogram: MACD (Moving Averages Convergence / Divergence) issued a down signal on Tue Apr 2. On Fri Apr 12 2024 the down signal gained strength. The MACD histogram is still strongly negative.
|
Ultimate Oscillator: The Ultimate Oscillator is falling.
|
Slow Stochastic: The Slow Stochastic has a down signal in place. It is oversold.
|
Relative Strength Index: The RSI signal is falling and positive. It is oversold.
|
Rate of Change: The rate of change signal is falling indicating Monday could end lower. It is however at levels where usually investors can expect a bounce.
|
Stock Market Outlook: Support and Resistance Levels |
| 5275 is resistance |
| 5250 is resistance |
| 5225 is resistance |
| 5200 is resistance |
| 5190 is resistance |
| 5175 is resistance |
| 5150 is resistance |
| 5125 is support |
| 5115 is support |
| 5100 is support |
| 5075 is support |
| 5050 is support |
| 5025 is support |
| 5000 is light support |
| 4990 is light support |
| 4975 is light support |
| 4950 is support |
Stock Market Outlook for Mon Apr 15 2024
Note that the SPX is now into support levels at 5125 and 5115. The index is oversold. We could see a bounce at the open, some selling and then an attempt to move above 5125. The close should be positive but Tuesday could see further selling depending on earnings. For today, a bounce is likely and a chance to close some trades that are profitable and get ready to open new trades later this week with freed up capital.
Potential Economic and Political Market Moving Events
There are major events this week on every day except Friday. Wednesday we get the Fed’s Beige Book.
Monday:
8:30 Empire State manufacturing survey is expected to rise to -10.0
8:30 Retails sales are expected to drop to 0.3%
10:00 Business inventories are expected to rise to 0.4%
10:00 Home builder confidence index is expected at 51, unchanged.

