Market Direction on Friday continued along the path of least resistance which is now up. The Dow and the S&P 500 broke through resistance on Thursday Jan 17 and on Friday Jan 18 2013 the market direction continued to move higher. It took five years for stocks to recover to this point but for many investors the severe bear market of 2008 to 2009 is still fresh.
Daily I receive emails from readers who are still trying to piece together retirement funds as many are still in homes that have tumbled in value and many more are holding large losses from the bear market and have not gone back into stocks. With the market direction continuing to move higher almost daily now and more stocks making 52 week highs, those on the sidelines are worried they are missing out and those in the markets are worried they are being suckered once again to enter the markets at what could be a top.
But understanding market direction and knowing the warning signs of when to leave the party are available. Perhaps one of the simplest market timing tools that has been effective for over 25 years is the VIX Index.
Market Direction and The VIX Index
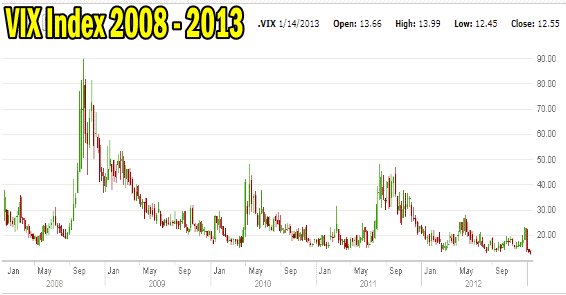
The VIX Index which measure the volatility within the markets hit an intraday low on Friday Jan 18 2013 of $12.29. The VIX Index with its low valuation is telling investors to stop worrying and put their capital to work. But should you?
Below is the VIX Index chart from January 2008 to January 2013. Since the incredible volatility at the height of the bear market of 2008 to 2009 stocks have clawed their way back. Not all stocks have participated mind you and many are still far below their lofty heights of 2007 but overall the VIX Index has been on a steady if sometimes rocky road to finally fall to $12.29 and close at $12.40 today as the S&P 500, Dow and NASDAQ have recovered almost all the losses of the last bear market.
VIX Index Market Direction
Market Direction and 10 Years of the VIX Index
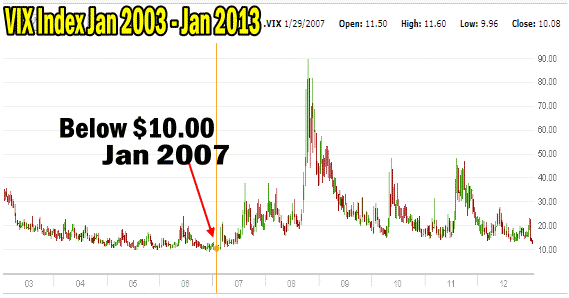
It has been a long time since the VIX Index was this low. We have to return to Jan 2007 to see the VIX Index at levels such as today when the VIX Index actually fell below $10.00.
Market direction and VIX Index 2003 - 2013
Contrarian Signals from the VIX Index
There is a belief among investors and analysts that low volatility levels within the VIX Index are actually signs of trouble ahead and indeed there does appear to be some truth to this anomaly since in the past each time when the VIX Index signaled low levels of volatility the market direction turned from up to down. At times when the VIX Index signaled low levels of volatility and market direction did not change from up to down, the market direction did become more erratic leading to whipsaws in the stock markets and a return to higher volatility.
But the question investors need to ask is whether they could have stayed invested and made a profit. The answer has always been yes, that low volatility valuations in the VIX Index correlate to rising market direction prices in the underlying indexes. Therefore staying invested as volatility falls has been the right strategy.
20 Years of Market Direction and the VIX Index
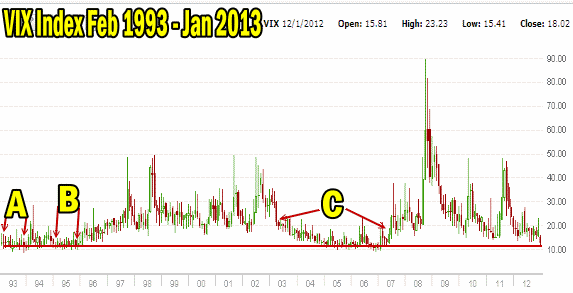
If we study the VIX Index over the past 20 years from February 1993 to January 2013 there have been only a handful of periods when the VIX Index entered low levels such as those seen on Friday Jan 18 2013. The weekly VIX Index chart from 1993 to 2012 is below. I have marked the past 3 periods in history when the VIX Index was this low.
Period A: 1993
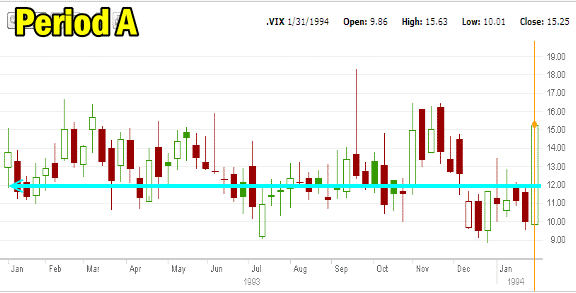
Over the past 20 years, the 1993 market stands out as having low volatility for the entire year. The blue line is at $12 on the VIX Index. You can see that for the entire year volatility failed to climb back above $20. You can also see that for 50% of the year the VIX Index registered at or below $12 indicating very low levels of volatility.
VIX Index Period A - 1993
The S&P 500 during that period returned 7.5%. While not spectacular investors who bought the index in January 1993 made profits by year-end.
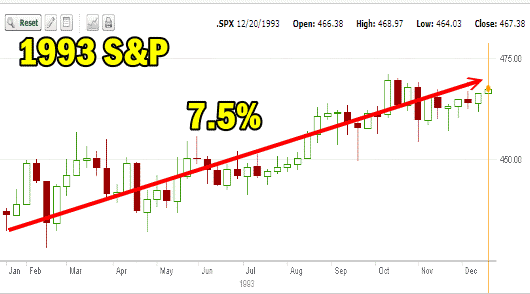
Market direction in 1993 returned 7.5% on the S&P 500
Period B 1995
In 1994 volatility stretched from a low of around $10 up to $28 but by 1995 the VIX Index again spent half of the year at or below $12.
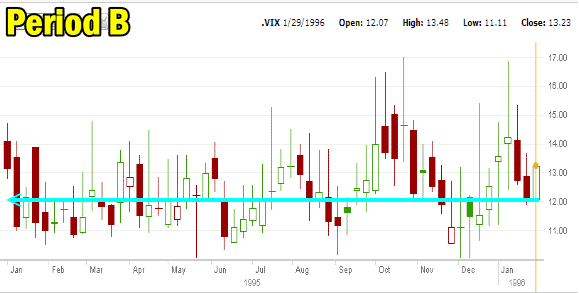
Period B 1995
During this period from 1995 to January 1996 the S&P 500 has a spectacular run returning 39% for the year in what was almost an entire year of the market direction moving relentlessly higher.
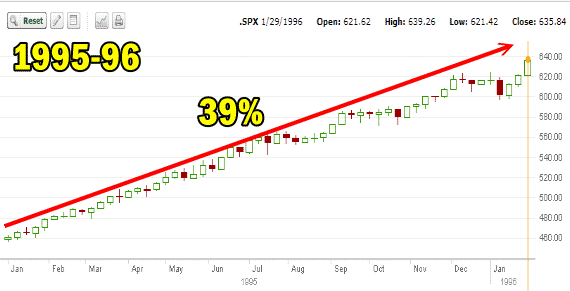
Market direction from Jan 1995 to Jan 1996 1993 returned 39% on the S&P 500
Period C 2005 – 2006
The final low volatility period during the past 20 years was the recovery from the 2000 to 2003 bear market. This severe bear market which lasted almost 3 years saw VIX Index levels as high as $48. The stock market recovery which commenced in 2003 saw volatility levels decrease until by early 2005 the VIX Index was regularly at or below $12. This low volatility level persisted until the end of 2006 when volatility again began to rise in the stock markets and there were no further periods of low volatility until this past Friday’s reading of a low of $12.29.
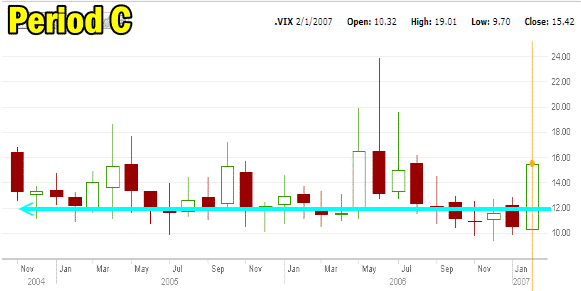
Period C 2005 - 2006
During this period from Jan 2005 to January 2007 the S&P returned 23% as again market direction remained moving higher throughout the two years,
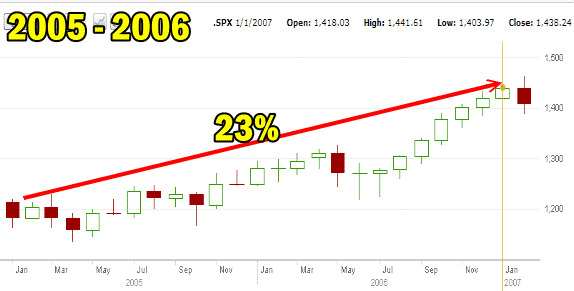
Market direction from 2005 to 2006 returned 23% on the S&P 500
Extended Low Volatility Time Periods
Therefore while many investors and analysts believe that low volatility levels are followed by a return to higher volatility, there are periods of low volatility that can last for more than a year as we have seen in the above examples.
When volatility is lower Put Selling to avoid assignment becomes more difficult to earn high option premiums. It makes sense really. If stocks are less volatile than they move around a lot less. This means option premiums are lower simply because the stock does not fluctuate as widely as it did during periods of higher volatility. Spreads tend to also have poorer returns again because volatility is so low that option premiums are poor. Iron Condors, Butterflies plus other option trades that have more than one position to manage also need to be more careful at the trades being placed, to keep them profitable despite the lower premiums being earning.
VIX Index Is Low – Should You Be Worried?
So should you be worried? I see no reason to be worried about the low volatility in the S&P 500 at present. Whether volatility climbs higher from here or continues lower, I am betting on lower volatility until we see what happens with the debt ceiling debate. When investors are concerned volatility rises. It really is that simple.
I believe the VIX Index can however be used to advise when you should become worried and when you should keep your capital in the markets. With the VIX Index pushing lower and hitting $12.29 on Friday intraday, many analysts point to it and are warning that the complacency in the markets means the highs we are seeing won’t last long. But I believe they have no way of knowing this and the VIX Index does not represent complacency.
Here is how many investors use the VIX Index to time the market direction and to know when to get their capital back out of the market or at least buy some protection for a downside swing in the market direction.
Using The VIX Index To Time The Market Direction
To understand the VIX Index as a market timing system, you have understand that the VIX Index is not telling you what tomorrow will bring. It is telling you what the next 30 days may bring. Let’s understand the VIX Index a little better to understand how to use it to time market direction and tell investors when to worry and when not to.
Understanding The VIX Index
The VIX is an index on the Chicago Board of Exchange which is measuring and predicting the expected level of volatility in the US Stock Market (primarily the volatility in the S&P 500) for the next 30 days. While many investors think it is reflecting “today’s” volatility, it is actually predicting what level of volatility to expect over the next 30 days. This is why the VIX Index is so handy to have around.
Many investors consider the VIX Index a “fear indicator”. There is good reason to consider it as such. When the market is in a downtrend, a correction or a period of uncertainty or concern, the VIX Index will reflect the fear or concern of investors shown by the VIX Index rising in value. When stocks plunge volatility moves up. When the market is in an uptrend or there is less uncertainty in the market, the volatility subsides. This is also reflected in the VIX Index as the index will decline.
So it isn’t complacency that is being measured but the selling pressures within the markets which in turn is measuring investor worry. Even when markets are falling investors can be complacent but when they are busy dumping shares the fear or level of concern is being reflected in the VIX Index rising in value.
The 20 Factor in the VIX Index
The VIX Index has been around a long time. I have used it since 1986 and indeed in 1987 the VIX Index hit an all-time high of 172.79 when the stock markets crashed over 25% in one day. So while we believe that the 2008-2009 bear market and the financial panic saw incredibly high levels of volatility, which they did, the VIX Index in October 1987 was almost double the levels seen in the 2008-09 bear markets because investors were dumping shares at an amazing pace.
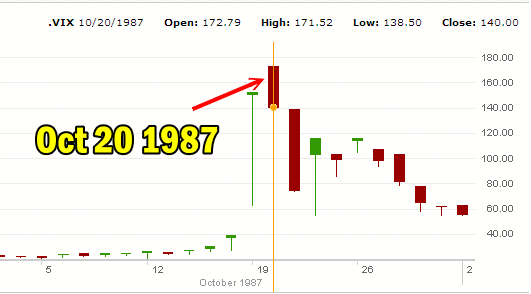
VIX Index Spike of October 1987
Over years of studying the VIX Index and market direction investors and analysts have come to believe that the $20 level on the VIX Index is the region to become concerned. Following various studies of market charts, it became obvious that when the VIX Index moved above $20 it almost always signaled that the S&P 500 would correct further. This became the level at which investors could consider purchasing protection. Anywhere below $20 was considered normal volatility with less chance of the market correcting severely. Severely being defined as more than 10%.
When the VIX Index fell below $14 it was considered a good sign that the S&P 500 would advance higher and the risk of a correction of more than 5% was almost unheard of.
Below $12.00 market direction in all the indexes almost always rose.
Simple And Effective Market Timing System
The VIX Index has proven over the course of 25 years that it is an excellent market timing system to determine market direction. Therefore with the VIX Index almost at $12 on Friday Jan 18 2013, it would appear that investors should indeed stop worrying and get their capital back to work in the S&P 500.
My Opinion on the VIX Index?
In closing I just want to add that I do not use the VIX Index as a market timing system, but I do check it daily and compare what it is advising against my preferred method of the moving averages. I prefer the 50, 100 and 200 day moving averages for market timing. That said, the VIX Index has a proven track record of being right and for most investors it makes a great guideline to know when to keep your capital in the stock markets and when to get your capital out.
Internal Market Direction Links
Understanding Short-Term Signals
Market Direction Candlestick Daily View (Members only)
Market Direction Portfolio Ongoing Trades (Members only)
