Buying puts is tough for a lot of people as you are going
against how we are taught about investing. We are all fed the
story of stocks moving higher. Why then buy puts? Simply because
the market trend at times is down and not up.
Terms
Of Use
By using this site,
you agree to be bound by its terms of use.
The full terms of
use can be read here.
If you do not agree to the terms of use, do not access or use
this site.
Nothing presented is financial advice, trading advice or
recommendations. Everything presented is the author's ideas
only. The author accepts no liability for its use including
errors and omissions. You alone are solely responsible for your
own investing and trading. There are considerable risks involved
in implementing any investment strategies and losses can be
large. Trade at your own risk.
SPDR S&P 500 SYMBOL - SPY - 2011 ETF Hedge Trades
ONGOING EVALUATION
& TRADE
There are many
SPDR ETFs. They cover just about every aspect of investing.
I use the SPDR S&P 500 ETF to hedge my stock positions
against market downturns. I have used the SPDR S&P 500
(stock symbol - SPY) since 1994. While I do not believe
anyone can truly guess short term market direction, I have
found the spdr puts for the S&P 500 ETF to be a very
effective means to hedge my put positions against market
gyrations. I very rarely buy spdr calls as I have found I am
not good on timing when to buy calls and sell them. However
buying puts and knowing when to sell them in stock market
downturns, I find much easier. SPDR ETFs options in general
have good premiums, but when the stock market turns down,
SPY put premiums are excellent which makes their trading a
viable strategy.
Below in the
SPDR INDEX I have written 3 articles that discuss the
methods I use for my ETF HEDGE spy trades. They explain the spy
options chain, spy trading, spy option prices, spy options
expiration and my method for trading either when I am in
front of the computer during the day and as such can make
spy trades throughout the day, and the method I use when I
am away from the computer and cannot follow the stock market
during the day. One final article shows how I trade put
options using the oscillator. This is my favorite method for
trading the SPY S&P 500
SPDR ETF.
Should you find my strategy and ongoing evaluation of
this trade of value I hope you will consider a tip
for the time I spend detailing out this trade.
I have set up a Paypal account for those
who would like to donate. Thank you in advance. Remember, nothing on my site is financial advice.
They are just my ideas and opinions. Investing is risky and losses can be large. Trade
at your own risk.
Read the
terms of use
YEAR 1: 2010 - Trade Commenced Jan 2010
Strategy: HEDGE
FOR DOWNTURNS IN OVERALL MARKET
Capital In Use At End Of 2010
12,000.00
Income Earned in 2010
$65,409.00
YEAR 2: 2011 Goal for 2011: 12%
Strategy: Buying Puts
To Hedge against Market downturn
Capital Currently In Use
0.00
Income Earned in 2011
$75631.00
YEAR - 2011
THERE IS NO GOAL WITH THIS TRADE. IT IS AN ETF HEDGE AGAINST
STOCK MARKET
DOWNTURNS ONLY
STRATEGY USED
- BUY SPDR S&P 500 PUTS FOR VERY SHORT TERM, SOMETIMES JUST
THE DAY
* ACTIVE TRADES ARE HIGHLIGHTED
IN YELLOW
SPY
Price at
time of
trade
Value
Jan 28 11
130.10
Bought 20 FEB 130 spy puts for
$2.66
COMMENTS: Often when a stock market makes a new high, the next day
there will be selling. Yesterday the stock market made a new high
and today the stock market first started up and moved higher and
then started selling. I put my order in to buy as the stock
market
started pulling back. This will only be a day trade.
32.00
(5352.00)
Jan 28 11
128.15
Sold 20 FEB 130 spy puts for $3.45
Comments: Out for the day, but I was too early as the stock
market
moved lower and ended up closing near the low at 127.72.
32.00
6868.00
1516.00
1516.00
Feb 9 11
132.00
Yesterday another new high and today
the stock market open down and started to sell off.
Bought 20 19MAR11 $132.00 spy puts @ 2.95
32.00
(5932.00)
Feb 9 11
132.10
Sold 20 19MAR11 $132.00 @ 2.85
Comments: Well the selling lasted for a very short period
and only fell to 131.61 and roared back to close at 132.27.
Obviously this was a mistake so I closed for a small loss.
Remember my strategy of building the cash cushion. If you
have not read the strategies and how I use apply the spdr
hedge, you can read
them here.
32.00
5668.00
264
1252.00
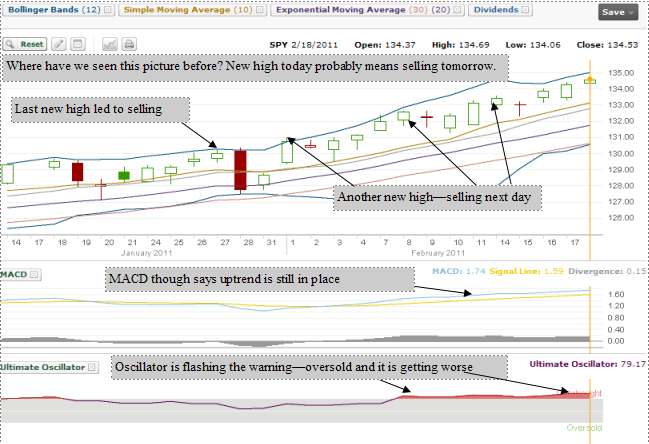
Feb 18 11
134.53
Every day the past few sessions this
SPDR ETF has set new highs. This can't continue and today looking
at the chart below, the candle is shows an undecided stock
market.
Here I go again. If the stock market opens up, moves higher and
then begins to sell off, I will buy spy puts again.
Feb 18 2011: The chart below
shows my ETF HEDGE strategy for tomorrow. I'm going on instinct again.
The past few sessions the Ultimate Oscillator keeps flashing the
OVERBOUGHT warning. This is normal for the stock market heading
this high every day. Meanwhile MACD indicates the uptrend is
still in place. However we have had so many up days we are
bound to get a down day very soon. Looking at the candle - finally it shows a bit of
indecision. We have a long weekend coming up. This could be
the break I am looking for. Monday is President's Day so
come Tuesday if the stock market opens up, and falls below today's
close of 134.53, I will be buying spy puts.
Feb 22 11
133.80
The stock market opened (133.12) lower than
Friday's close, and climbed to 134.56 on small volume and
then more selling.
Bought 20 spy puts 19MAR11 $134 @ 2.97
32.00
(5972.00)
Feb 22 11
131.75
Sold 10 spy puts 19MAR11 $134 @ 3.80
Comments: This trade worked out well and I closed right near
the end of the day. The SPY closed at 131.83 for the day.
However it could have been an error to close as the next two
days the stock market continued to sell off.
32.00
7568.00
1596.00
2848.00
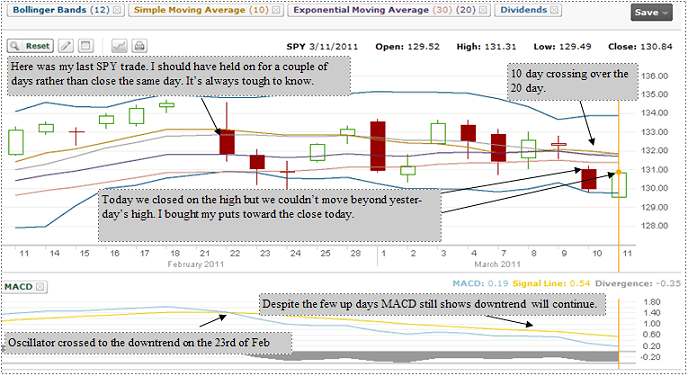
MAR 11 2011:
Today at the close I bought spy puts. Just 5 spy puts, in
case I am wrong, but the chart below indicates to me that
the stock market will move lower before it gets better.
Mar 11 11
130.80
Bought 5 spy puts 16APR11 131.00 @ $3.05
13.25
(1538.25)
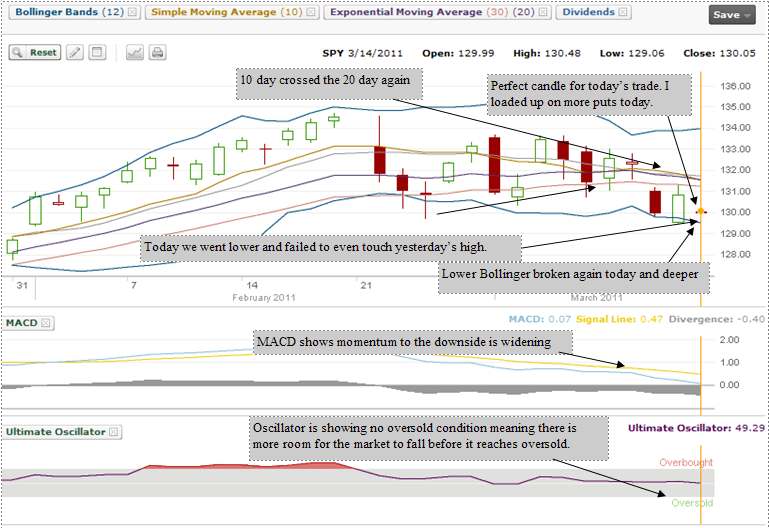
Mar 14 2011: You
can see on the chart below all my reasons why I loaded up on
more Spy Puts today.
Mar 14 11
130.10
Bought 20 spy puts 16APR11 131 @ $3.80
32.00
(7632.00)
Mar 15 11
126.73
Sold 25 spy puts 16APR11 131 @5.68
38.25
14161.75
4991.50
7839.50
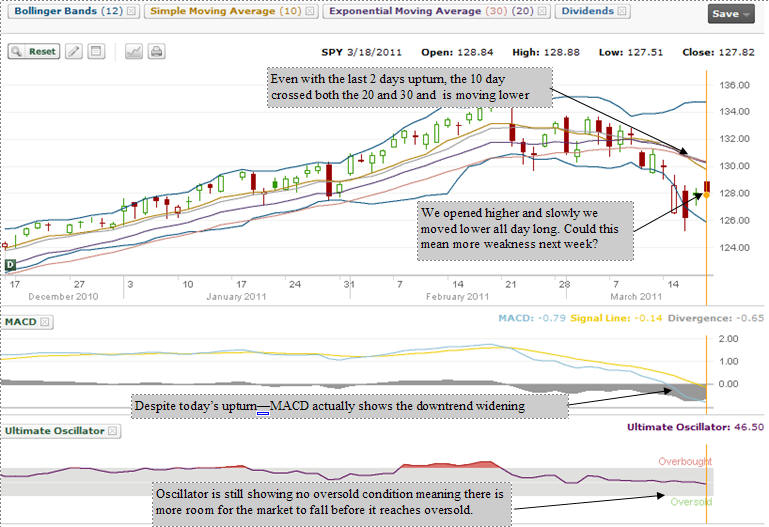
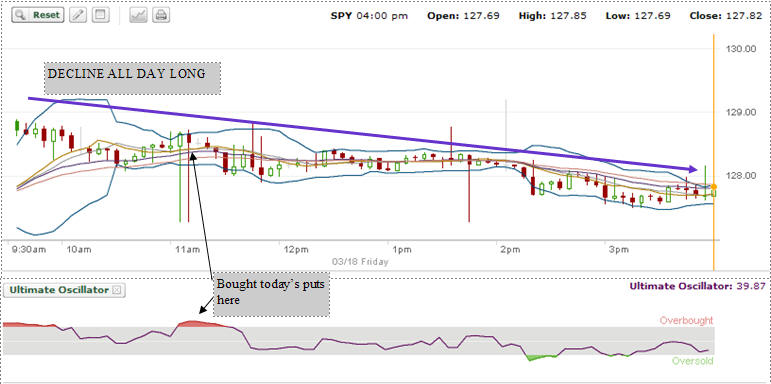
Mar 18 2011:
Bought more Spy Puts today. Looking at the chart the last
two up days could be just a lull before we move lower. There
is a great deal of uncertainty from Japan and a weekend
ahead of us. With options expiry today, perhaps that would
account for the stock market moving sideways most of the day.
Mar 18 2011:
Early in the morning the oscillator showed overbought and I
picked up just 10 Spy puts. I have built up a decent size
cash cushion in case I am wrong next week.
Mar 18 11
128.66
Bought 10 16APR11 $129 spy puts @ 2.96
19.50
(2979.50)
Mar 21 2011:
Wrong, yet again! I sold at the open as my chart shows
the stock market may try to climb now back to the Feb high and
possibly break through. With the news out of Japan regarding
their nuclear problem, having been put on the back burner
and the allied coalition having been formed against Gaddafi,
the stock market is calmer and investors are rushing back in so as
not to miss the rebound. This bodes well for my spy puts
although if the stock market climbs enough and calms investors'
nerves then the VIX will decline reducing my premiums.
Here are two
key points from the recent SPY trades that I used and which
are mentioned in the 3 strategy papers I wrote on how I use
the SPY for hedging. To read those scroll to the top of the
pageand go to the SPY INDEX:
1) Staying
Just In The Money and 1 Month Out Can Really Assist My
Trades:
This morning's loss was $559.00. This is why I stay a month
out and slightly in the money. Those spy puts hold their value
better and on this morning's move up my loss is contained to
$559.00, where those that are out of the money have lost
much bigger premiums. Meanwhile those that are deeper in the
money have also lost more on the big rally as they tend to
reflect the actual movement of the SPY since they are deeper
in the money and a lot of the premiums are simply reflecting
the actual SPY valuation at the time of being bought or
sold.
2) Easing
Myself Into The SPY Through Purchasing Groups Of Contracts
Not "ALL OR NOTHING"
As well I
always try to gauge the stock market sentiment. On Friday we had a
declining stock market but it still had jumped higher on the
better news out of Japan. It was a "toss-up" whether the
stock market would pullback on Monday (today) or move higher. My
technicals showed that the stock market would move lower but
instead of jumping in and buying 30 spy puts I took my time and
bought just 10. The same back on March 11 2011 when I bought
just 5 spy puts as the stock market wavered. It was not until the
Monday (Mar 14) that the direction was perfectly clear and I
bought an additional 25 spy puts.
3) The
Importance Of My Cash Cushion
Make no
mistake about it though - on May 15 when I sold my spy puts in
the downturn the return was better than 54%. Today's loss
was 18.7%. These are not small percentages and "trading" the
SPY regularly can really hurt the inexperienced investor.
This is certainly not something I would do. The Cash Cushion
that I build up is so important. I make sure that my trades
with the SPY puts are short, usually a day or two and then I
close for the profit. It is imperative to me that I build up
that profit quickly to cover those times when I am wrong. It
is my "insurance" so to speak.
4) Selling
Early When The stock market Turns Against Me
My outlook on
Friday was that the stock market would move lower. I eased myself
into the trade by purchasing just 10 contracts. Yet today
was not like last Monday. The stock market moved against me and I
closed immediately. This could be a mistake as later in the
day the stock market could soften, but I take no chances. This is
not gambling, it is investing. I have clear goals,
objectives and a clear strategy. My trade was not working
out and the SPY is not a stock like KO or JNJ. I use it as a
hedge against a stock market downturn only. Premiums are large on
the options and can rapidly dissipate. I do not second guess
or "hold" waiting to see if the stock market may turn and afford
me a smaller loss. I get out because I know there will be
other opportunities when I will be right and I know that I
am using it solely to hedge myself against a downturn in the
stock market. The stock market is not turning down and so the trade is
closed. No emotion, no need for alarm. When I have a plan it
is easy to make the decisions.
BELOW IS A SHORT ARTICLE ON HOW
I TRADE THE SPY DURING THE DAY FOR "DAILY INSURANCE"
- THIS ARTICLE IS FROM THE AUGUST 10 2010 - You can view the
entire 2010 SPDR S&P 500 ETF trading history by going to
2010 SPY TRADES.
Aug 19 10 - Quick overview. I had a few
emails just before open this morning asking me about the
stock market ( as the jobs numbers continue to look bad and
futures were down ) and how to judge buying spy puts for
trading. While I have a lot of the details below on this
page, nonetheless, here is a look at my trade so far today.
I have put a yellow line where I could see the stock market
under stress. At that point the SPY was at 109.20. A few
minutes later I bought my PUTS. By then the stock market had
fallen to 108.94. Then look to the volume and the
oscillator. The Oscillator shows oversold within a little
over an hour later and the volume began to pick up. I sold
my puts after 12:00 when the stock market began to recover
from the oversold condition. We could move lower from here,
but I have brought in some profit and that's what matters.
If options didn't expire tomorrow I would have hold my puts
longer, but most options expiry days can provide unexpected
results. It is important to remember that in my opinion it
is impossible to pick tops and bottoms and get the
"ultimate" return. I look to add small gains to my overall
spy put cash cushion which little by little will build
protection long term for the risk I have taken with my
equities. Other traders will buy spy puts on any sign of
weakness and hold them over a period of weeks and months as
insurance against a steep decline. I am looking for "daily
insurance" or insurance for just a few days. As I build my
profit I can afford to be wrong sometimes when buying and
selling the puts, but I have built a cash cushion that I
hope will grow to eventually protect against a major decline
should that occur. Because I do short term trading of the
spy puts, this means that should the stock market fall
drastically I will probably not be as well protected as
someone holding puts long term. However I look to my cash
cushion to help me in the event that happens and I am not
holding spy puts all the way down, but buy and selling short
term.
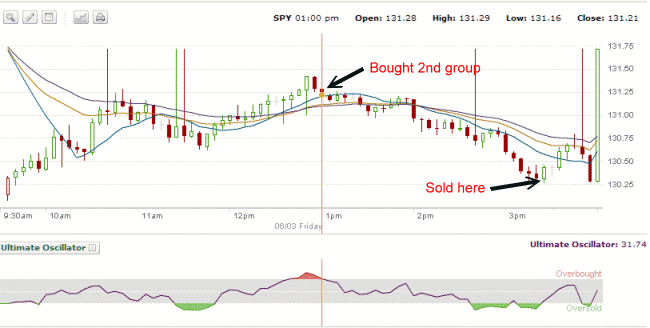
Today was again a very easy
trade on the SPDR Hedge strategy. The stock market opened
lower and the spy options chain was already showing good
premiums but by noon, the market had climbed higher. As the
SPY moved higher the oscillator indicated overbought and I
purchased SPY puts. Sticking with my spy hedge strategy for
the past 17 years, I sold a month out (JUNE 2011) and
slightly in the money options and selected the SPY PUT
$135.00 strike.
Stocks could not recover and by
afternoon they had climbed back almost to my purchase price,
but the oscillator did not show overbought. As the spdr S&P
500 ETF fell towards the close the oscillator again showed
oversold. I sold my spy puts as stocks began a small bounce.
I will keep posting these SPDR
ETF trades as they occur to allow readers the opportunity to
keep reviewing them to determine their success rate. You can
go back in time and look at previous trades for this year
that did not work out and also check out the
2010 SPY Hedge
trades. This should help investors determine whether using
the oscillator for trading the SPY SPDR ETF has merit or not. As well
it should help those who are interested, in perhaps
formulating their own strategies or tweaking mine to better
suit their own trading comfort level.
It was
obvious from my comments yesterday that I assumed there
might be a good bounce today. Overall though the trend is
lower after the past 2 days. Therefore to keep working on the SPDR Hedge strategy
I waited for the oscillator to indicate overbought and for
it to begin to pull back. I will close this trade sometime
today. Probably around 3:00 or 3:30 before the end of the
day when they market could try to bounce back for the close.
Below is the chart from the sale
of my SPDR PUTS. You can see there is no oversold condition
on the SPY, but you must recall that the trade is to keep
building up the cash cushion. Remember to read all about the
SPDR ETF hedge
in order to understand what I am doing here and why.
The important aspect of this
trade is to build a large enough cash cushion to protect my
US Portfolio from a 10% or 15% decline. This will mean a
build up of cash somewhere around 60,000 to 70,000 in
capital by the end of the year.
May 6 11
133.98
Sold 20 $135 18JUN11 SPY PUTS @ 3.61
32.00
7188.00
1736.00
11425.50
May 12 2011 - SPDR ETF Trades
Again
weakness in the market makes for opportunity. By using the
Ultimate Oscillator Indicator and adding in MACD I get a
better picture. The who purpose of these short trades is to
build up a cash cushion, which I do every year, in order to
protect the capital that is in use, should the overall
market decline.
Remember that these trades are short term trades- usually a
day or maybe two. When I see the opportunity I take it. In
the chart below you can see where I bought the SPY puts. Now
you can see where I sold them. The Ultimate Oscillator did
not give an oversold indication but at 26.70 it was pretty
close, however the MACD was again flat at -0.01. MACD
turning to a flat signal usually indicates that the present
move is over and a new move will begin. For these reasons I
sold my puts.
May 12 11
134.05
Bought 20 SPY PUTS 18JUN11 $134
@ 2.81
32.00
(5652.00)
May 12 11
133.70
Sold 20 SPY PUTS 18JUN11 $134 @
3.06
32.00
6088.00
436.00
11861.50
May 16 2011 - SPDR ETF Trades
These
SPY trades are increasingly easy in a downturn. The Ultimate
Oscillator almost went overbought and then pulled back. I
waited but with no clear picture I looked to MACD which
showed a break in the Divergence to 0.00 from 0.11 earlier
in the day. I bought my SPY puts. But when I sold them near
the close I was too early. I felt the market might rally
into the close as it is important when selling on weakness
to remember that this is no bear market, just weakness. That
means that buyers will show up and often right near the
close when the market looks its weakest. I was wrong today
though as the market sold off even lower before a slight
rebound at the close.
I sold
my SPY puts in the morning at the open as the market had
gapped down on the unemployment news. By 1:00 PM the S&P 500
was trying for a comeback but the overbought signal was
there and I waited and then bought as the market began to
falter. Selling was easy. I waited for the oversold and then
just waited for the SPY to keep falling and then turn
around. This was a perfect day for my SPY trade strategy
based on the Ultimate Oscillator.
Today's
rally has to be the bounce I mentioned in my
market
direction call on June 6. It could last a few days, but
I doubt it. I really thought this bounce would have started
earlier in the week. Today when I charted the week, the
Ultimate Oscillator didn't show overbought until almost 3:00
PM. I bought my 20 puts at that time. Remember I have
already made a nice cash cushion to protect my trade if it
goes the wrong way and this is the bottom and we turn up.
Personally looking at my technicals, this rally has to be
just a "relief" rally and the market will move lower next
week. I have gone all the way to September with my bought
puts, just in case the market tumbles another 5 or 6 percent
from this level. If it does, then the September puts will
have a lot more premium, than just one month out.
Sold 20 SPY PUTS 17SEP11 $129 @ $6.17
COMMENTS: I sold my SPY puts toward the close of today. I
did this not because I believe the market may rally, but to
lock in this profit. I may purchase more spy puts in the
coming days.
Bought 20 SPY Puts 17SEP11 $128 @ 3.95
COMMENTS: I bought 20 puts toward the early afternoon as
there was no real follow through from yesterday and with the
Fed speaking later I believe the market may pull back.
I will sell half my position if there is a sell off into the
close and then hold the rest for Thursday to see if there is
more selling.
Sold 10 SPY Puts 17SEP11 $128 @ 5.20
Comments: With the plunge this morning it was obvious that
it was time to unload the rest of my SPY puts.
19.50
5180.50
1609.00
20048.50
JUN 23 2011 -
I did
not expect a big pull back out of the gate today. I did
think there would be some selling but not 200 plus points
lower on the DOW. I sold my remaining 10 SPY puts early in
the morning as I felt the decline was a little overdone. In
the afternoon the market actually began a climb and ended up
with a half a percent loss. A very nice recovery. At
the close I could have bought my SPY puts back again, but I
didn't.
So what is going on? The answer
may lie in the VIX. In the chart below the Volatility index
shows the March rise in volatility when the Japanese
earthquake, tsunami hit and the markets sold off with all
the problems associated with Japan. However look at the VIX
now. There was a spike up but nothing to indicate alarm as
much as the March period. In fact the VIX is declining
again. This morning even with the selloff the VIX did climb
but to level I would expect with a 200 plus plunge on the
DOW. Instead the VIX is still declining from its most recent
high.
This is a sign of complacency
among investors. The number of bulls remains above 30% and
therein may lie the problem. Without any kind of panic or
serious down move on large volume, most investors seem to
feel that this latest correction is simply a short term blip
and the market will resume its rise. The VIX reflects their
complacency. Therefore the market may still have room to
climb and then sell further. Perhaps if it breaks the March
lows, we will see a day or two of heavy selling and the
number of bulls will collapse below 25%. Then we might be
able to put in a bottom. Until then the see saw action may
continue.
In this kind of environment, I saw no reason to buy my SPY
puts back, at the close. I can just as easily wait to see
what Friday brings. The strong push up from the lows of the
morning could easily mean the market is going to move
higher. I still believe if it does, it is a bounce before
more selling. Meanwhile though, I see no panic in the market
and as such, no reason to jump in and quickly buy back my
SPY puts. I have plenty of time to buy them tomorrow or even
perhaps Monday.
Bought 15 SPY PUTS 17SEP11 $128 @ 4.52
COMMENTS: Today's rally was poor at best. I have updated my
market direction charts
which
you can view here. I believe it is foolhardy to stay in
this market without some protection.
25.75
(6805.75)
Jun 29 11
129.90
Sold 15 SPY PUTS 17SEP11 $128 @ 3.79
COMMENTS: With the market holding ground there is no need to
hold these further. I will consider buying more once the
rally ends. See my comments
July
Rally In The Works?
You can
read about today's trade within the context of my market
direction call for today, July 13, which I entitled
One Ugly Chart.
I bought my SPY puts around 10:50 AM when I noticed that the
XLF had already stopped rallying. I also based today's
action on my market call from
July 12
RAZOR'S EDGE where I indicated that I believe any rally
had to be sold into as overall the market wants to move
lower before it can move back up.
After
looking at my charts today and comparing them to past
markets at this point in the market, I believe the market
will fall through the 1300 easily and retest the 200 day
moving average. I purchased additional SPY Puts to hedge my
portfolio and take advantage of any additional fall.
You can
read my reasons and comments and see my charts here.
Jul 15 11
131.59
Bought 20 SPY PUTS 20AUG11 $131.00 @
2.64
AS OF JULY 18 I am now holding just 10 of these puts having
sold 10 on July 18 2011
Today's action is indicative of
investors' nervousness.
Gold pushed easily through $1600 US an
ounce as investors and world governments
hedge themselves against further
deterioration of the Euro, sovereign
debt woes and the US Debt Ceiling issue.
I always feel it is better to keep
taking profits when they appear and by
holding onto a few spy Puts I still can
take advantage of any further downturn
during the rest of the week.
The market remains soft, but it isn't
time for a collapse yet. Earnings are
strong still and it truly is more a
matter of:
1) Many stock are overvalued. This has
to get worked through before stocks can
move higher. That means consolidation
and for many investors, consolidation
can hurt.
3) The US Debt Ceiling debate. Once this
gets resolved another anxiety related
issue will be removed.
Don't get me wrong. This market has a
lot of trouble ahead of it and I am
expecting more volatility, move
pullback, more bounces and certainly I
think a retest of the 200 day moving
average. For this reason I am still
holding onto the remaining 10 SPY puts.
JULY
21 2011 -
Market Must Not Re-Test The 50 Day Moving Average Again
While
Wednesday was a lack luster day and I really couldn't see
the market running a lot higher, the market took off in the
morning and I sold my remaining 10 SPY Puts for a loss.
Judging market trends is always tough and I am wrong as many
times as I am right. I believe insurance is important, but
right now the market may go sideways and it may even pull
back a bit, but unless it falls below the 50 day moving
average I think the trend is sideways to up. If though we
should pull back to the 50 day moving average, then I
believe it will be time to buy spy puts again. As well
should the market pull back to the 50 day again, it will be
a very bad sign and most likely the beginning of a major
pullback which could actually signal the end of the bull
market. Let's hope there is still upside left in this bull
market.
With
the disappointing infighting over the US Debt Ceiling, I
just have to believe this market will retest the 1310 on the
SPX. I therefore bought 20 SPY puts for a day or two. If the
market breaks the 1310, then it will probably break the 50
day and this is the third time. Since beginning investing
over 35 years ago, it is a rare event with the market can
break the 50 day 3 times in a row and not fall from there.
Bought 15 SPY PUTS 17SEP11 $131 at
3.77
COMMENTS:
Not as big a bounce as I anticipated in
last night's
market direction call. Nonetheless I bought puts and then
sold 10 of them toward the close of the day. I am holding 5
overnight to see if we get a drop in the morning. The
selloff during the day is certainly not bullish.
Bought 30 SPY PUTS 17SEP11 $128 @ 3.87
I believe investors might
consider SPY Puts to protect their positions. With the
market this high there is a lot of room for the market to
fall. Just be aware that after 7 days of growing selling,
the chance of a bounce is very high.
Sold 10 SPY PUTS 22OCT11 $115 @ 6.21
Comment: This leaves me with 30 SPY Puts still being held
19.50
6190.50
Sep 14 11
117.60
Sold 10 SPY PUTS 22OCT11 $115 @ 4.45
Comment: I was stopped out at $4.45 - I have moved the
remaining 20 stops higher
19.50
4430.50
Sep 15 11
119.67
Sold 20 SPY PUTS 22OCT11 $115 @ 3.27
COMMENT: I was stopped out again ending the SPY Put trade.
Obviously the market is moving higher at this stage. This is
the great thing about the cash cushion I build throughout
the year. When I am wrong, such as on this purchase of the
SPY Puts, it protects me from the losses.
To read an extensive article about this trade and the loss
taken, click here.